



Leaderboard
-

beastfan11
Members4Points2,106Posts -

Tr0y
Members3Points2,360Posts -
Gordon Bombay
Members2Points8,221Posts -

OwenFromTheRacer
Members1Points37Posts



Popular Content
Showing content with the highest reputation on 10/30/2026 in all areas
-
100% spot on, my dude. The park is in better shape than most claim/assume. There’s plenty to be improved upon, as is always the case with any park. But the last six years have been solid for KI. Grateful for that, especially in the context of the BS merger.4 points
-
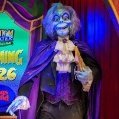
Personally I was more in the camp of not wanting AF1 for KI. Although the ride is rated highly in the GTA. The ride itself has low capacity and there wasn’t really a good place to put it at Kings Island without it seemingly being out of place. What I mean by that is how does the coaster fit cohesively within an area of the park without being gaudy. Beautiful parks like Dollywood, and Busch Gardens don't stack coasters on-top of each other for the sake of having a coaster, those coasters more of less flow within their respective areas. I understand the notion and feeling that “KI hasn’t been getting anything” but in reality Kings Island has been getting something new almost yearly. 2020: Area 72 and Orion. 2022: Park’s 50th birthday with a lot of refurbishments around the park. 2023: Adventure Port and 2 new rides with Sol Spin and Cargo Loco. As well as a much welcomed refresh of The Adventure Express 2024: Camp Snoopy and Snoopy Soap Box Racers. 2025: River Racers 2026: Phantom Theatre Opening Nightmare Yes, none of these outside of Orion have been major thrill rides, but a lot of people have been missing the major details over those years. Kings Island’s crown jewels, I.E. their wooden coasters have been receiving major overhauls over those years. Not just simple new track but entire sections of coaster being torn down to the foundation and rebuilt. The Racer was finished and repainted and here soon enough so will The Beast. The Beast itself will almost be entirely new if rumors are true and the remaining track sections are completely this offseason. That can’t be cheap.3 points
-
lol Uncle Festhaus posting a pay-walled article for “news” he got from Twitter.2 points
-
Yeeeah, definitely not happy about this move. And not just because it didn't end up at KI. Granted, I would have been absolutely thrilled for it to have ended up out here because we are going into year 7 without a major coaster installation and this would have been a powerhouse of an addition. But I definitely hate that there are other parks other than KI that could have used it more. Heck, I'd have been happy if Carowinds got it. Magic Mountain is already so stacked with coasters-including and not limited to having a dueling RMC already-along with getting the first of its kind Thrill Glider next year. This just feels really ridiculous and stupid. Am I surprised? No. This company continues to slip further into a nonsensical spiral. I'd like to think they somehow know better than us peon guests, but they don't exactly have a history of showing us they know their rear end from a hole in the ground.1 point
-
The list of WinterFest rides on the website is from last year, they will update it when the 2026 WinterFest page comes out1 point
-
It was for the year. From the article: "For example, Six Flags, which merged with Cedar Fair last year, doesn’t reveal individual park attendance figures. But McClure said Cedar Point came within 5,000 guests of beating the park’s record attendance of 3.617 million in 1994."1 point
-
Was that record for a single day or the entire season? I thought it was a single day — especially since I remember a specific date being attached to it — but I can't remember right now. If Six Flags is about to start selling off more parks (particularly big parks), then I hope it's to companies that either have a ton of extra cash or to a "new" company similar to what happened with Enchanted Parks; although hopefully without the sale of the land under the parks to a different company. I was going to mention this in another discussion, but the guys over at Theme Park Insider were recently discussing Six Flags' path forward and talked about a few ways they could handle their properties. One option was to keep offloading parks and using that money to pay down debt. Another option was to basically split the company apart, sending the debt/bad reputation/etc. off into whatever keeps the Six Flags corporate entity. I didn't understand this one as much, but it was described as something that chemical companies (for example) have done before. As for my thoughts on Arieforce One going to Magic Mountain, I think it's a very puzzling decision. This could entirely be a Top Thrill 2/Siren's Curse situation where the company is hoping to take eyes off of X2 closing. Either way, I don't think Magic Mountain needs it like the other parks without RMCs do. I wouldn't be shocked if this was redirected after X2 was officially retired. I'm waiting to hear how the permitting works out for this considering the total mess that was made with Thrill Glider's permits. Six Flags wants to increase MM's attendance numbers and I'm sure this is now going to play into that. This would be a great opportunity to dump the legacy Six Flags brand from Magic Mountain. The park has already taken the SF name off of their parking tolls and replaced the big park sign at the front. The SF name is also tiny on the marquee sign that faces I-5, and could be easily removed if desired. I think the best place for it would be in X2's plot. It could either sit with the second half going up toward Great American Revolution (as suggested by ElToroRyan and Christian G Coasters) or have some part of it arching over the parking tolls (depending on what land the park owns). There will have to be lots of support work and land grading wherever it goes at Magic Mountain.1 point
-
I know this is kind of ugly but I copied and pasted Page 31 from this year's TEA report. As disco2000 said, take it with a grain of salt on how accurate the data. RANK PARK / LOCATION % CHANGE ATTENDANCE 2024–2025 ATTENDANCE 2025 ATTENDANCE 2024 1 Magic Kingdom Park at Walt Disney World ResortLake Buena Vista, FL, U.S. -0.2% 17,800,000 17,836,000 2 Disneyland Park at Disneyland ResortAnaheim, CA, U.S. 0.4% 17,406,000 17,337,000 3 EPCOT at Walt Disney World ResortLake Buena Vista, FL, U.S. -0.2% 12,109,000 12,133,000 4 Disney's Hollywood Studios at Walt Disney World ResortLake Buena Vista, FL, U.S. -0.2% 10,312,000 10,333,000 5 Disney California Adventure Park at Disneyland ResortAnaheim, CA, U.S. 0.4% 10,090,000 10,050,000 6 Universal Studios Florida at Universal Orlando ResortOrlando, FL, U.S. -2.1% 9,300,000 9,500,000 7 Universal Islands of Adventure at Universal Orlando ResortOrlando, FL, U.S. -2.6% 9,200,000 9,450,000 8 Disney's Animal Kingdom Theme Park at Walt Disney World ResortLake Buena Vista, FL, U.S. -0.2% 8,782,000 8,800,000 9 Universal Studios HollywoodUniversal City, CA, U.S. -8.0% 8,000,000 8,700,000 10 SeaWorld OrlandoOrlando, FL, U.S. -0.3% 4,335,000 4,347,000 11 Knott's Berry FarmBuena Park, CA, U.S. -4.2% 4,315,000 4,503,000 12 SeaWorld San DiegoSan Diego, CA, U.S. -0.2% 4,015,000 4,022,000 13 Universal Epic Universe at Universal Orlando ResortOrlando, FL, U.S. New 4,000,000 N/A 14 Busch Gardens Tampa BayTampa, FL, U.S. -4.4% 3,800,000 3,975,000 15 Cedar PointSandusky, OH, U.S. -7.5% 3,497,000 3,780,000 16 Dollywood Pigeon Forge, TN, U.S. 8.1% 3,400,000 3,144,000 17 Canada's WonderlandVaughan, Ontario, Canada -1.0% 3,232,000 3,264,000 18 Kings IslandMason, OH, U.S. -6.9% 3,226,000 3,465,000 19 Six Flags Magic MountainValencia, CA, U.S. -4.0% 3,184,000 3,317,000 20 HersheyparkHershey, PA, U.S. 1.7% 3,050,000 3,000,000 TOTAL 1.5% 143,055,000 140,956,0001 point
-
The Christmas tree by the security gates is usually going up by this past weekend. Now, people used to complain that they should not see WinterFest decorations before Haunt is over. So, are they listening to that feedback or cutting back this year?1 point
-
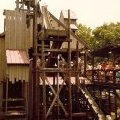
0 pointsWoodies are now two click restraints....and more light added to beginning of lift hill. And ride ops hold a stick to confirm two clicks.0 points



This leaderboard is set to New York/GMT-04:00